
Lichfield district had 1,605 people claiming jobless benefits in October, the most since August 2024. Under-25s reached 370, the most since July 2021.
The number of people claiming unemployment-related benefits in Lichfield district rose to 1,605 in October. That is the highest count since August 2024, when it was 1,620.
It is 145 more than a year ago, a rise of 9.9%. Only Stafford rose faster among Staffordshire’s eight districts. Claimants aged 16 to 24 rose again, to 370, the most for that age group since July 2021.
The figures are the ONS claimant count, published through nomis on 17 November. For Lichfield district in October 2026:
- 1,605 people claiming, 2.4% of residents aged 16 to 64
- up 35 on September’s revised 1,570
- up 145 on October 2025, when the count was 1,460
- 370 aged 16 to 24, 840 aged 25 to 49 and 390 aged 50 and over
The ONS rounds each age band separately, so they add up to 1,600 rather than 1,605.
The district is still a low-unemployment area. Its 2.4% rate is the second lowest in Staffordshire, after Staffordshire Moorlands at 2.1%. The county rate is 2.8%, the West Midlands region’s is 5.4% and the United Kingdom’s is 3.9%. The direction is what has changed: the count has risen in each of the last three months.
October does not usually go up
Between September and October the Lichfield count fell in every year from 2020 to 2024. It rose by 35 in 2025 and has risen by 35 again this year. Before that, it last rose in 2018 and 2019.
The ONS figures are not seasonally adjusted, so comparing the same month across years is the fairest test. On that test, October 2026 is the highest October since 2021, when the count was 1,920 as the district came out of the pandemic.
Under-25s are the group that is moving
There were 370 claimants aged 16 to 24 in October. That is up 5 on September’s revised 365, and up 70 on October 2025, when there were 300. That is a rise of 23% in a year. The last time the figure was higher was July 2021, at 390 (nomis, 16 to 24 series).
The other age groups grew more slowly:
- 25 to 49: 840, up 40 on October 2025, a rise of 5%
- 50 and over: 390, up 25 on October 2025, a rise of 7%
How Lichfield compares with the rest of Staffordshire
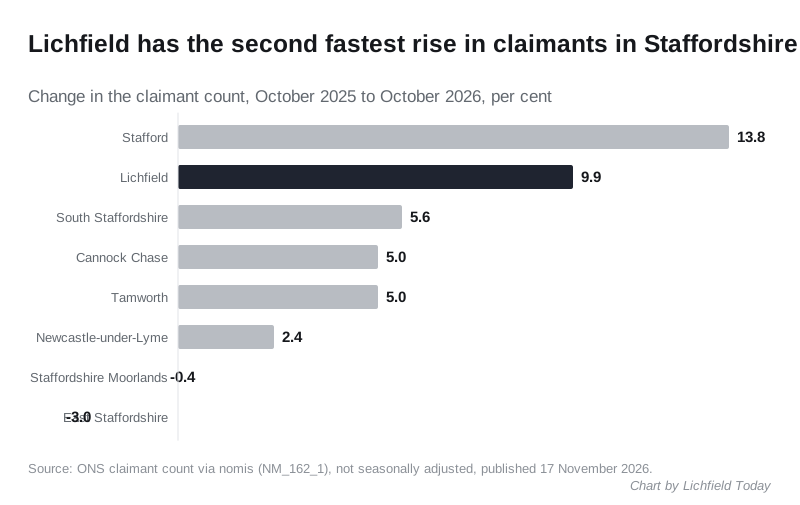
Six of the eight districts rose over the year. Stafford’s count grew fastest, by 270, or 13.8%. Lichfield came second.
| District | Claimants | Rate | Change on Oct 2025 |
|---|---|---|---|
| Stafford | 2,225 | 2.6% | +270 (+13.8%) |
| Lichfield | 1,605 | 2.4% | +145 (+9.9%) |
| South Staffordshire | 1,780 | 2.7% | +95 (+5.6%) |
| Cannock Chase | 2,010 | 3.1% | +95 (+5.0%) |
| Tamworth | 1,670 | 3.3% | +80 (+5.0%) |
| Newcastle-under-Lyme | 2,365 | 3.0% | +55 (+2.4%) |
| Staffordshire Moorlands | 1,190 | 2.1% | -5 (-0.4%) |
| East Staffordshire | 2,550 | 3.2% | -80 (-3.0%) |
Source: nomis, all Staffordshire districts and rates. Rates are the share of residents aged 16 to 64. Counts are rounded by the ONS to the nearest five.
On the month, Stafford rose most, by 85, then South Staffordshire by 60. Cannock Chase and Staffordshire Moorlands were the only districts where the count fell.
Where in the district
The ONS also publishes the count for each of the district’s 22 wards. In October, the highest rates were:
- Fazeley, about six miles south-east of Lichfield next to Tamworth: 130 claimants, 4.7%, up 20 on September
- Chadsmead, Lichfield: 125 claimants, 4.5%
- Curborough, Lichfield: 110 claimants, 4.3%
- Stowe, Lichfield: 135 claimants, 3.5%, the most of any ward
- Chasetown, Burntwood: 115 claimants, 3.4%
Shenstone had the lowest rate, 0.9%, with 10 claimants (nomis, Lichfield wards). Ward counts are small and rounded to the nearest five, so a change of five or ten in a month can be rounding rather than a real movement.
September has been revised down
Last month we reported that the count had risen to 1,595 in September. The ONS has now revised September to 1,570, and claimants aged 16 to 24 from 380 to 365. The revised figures still give Lichfield the steepest annual rise in Staffordshire for September, at 10.2%. But the August to September rise was 40, not 65, which is no longer the biggest for that month in the series. Our September story now carries a note.
The ONS quality report says the Universal Credit part of the count allows revisions to the previous month. October’s 1,605 could move in the same way next month.
What the claimant count is, and is not
It is not the unemployment rate. The ONS counts people claiming benefits mainly because they are unemployed. Since Universal Credit, that includes people in work whose earnings are low enough that they must look for more. A rise can mean fewer jobs, fewer hours, or more people being asked to search.
What it means for you
If your income has fallen, help with council tax comes from the district council, not the DWP. Lichfield District Council runs council tax support, and its benefits section has a benefits calculator, the Crisis and Resilience Fund and a referral to Citizens Advice.
If you are 16 to 24 and looking for work, your age group has grown by almost a quarter in a year, while the district’s headline rate still looks low.
The November figures are due from the ONS in mid December. We will report them, and any revision to October, when they appear.
Sources
- ONS claimant count, Lichfield district, 25-month series, dataset NM_162_1, not seasonally adjusted, updated 17 November 2026
- ONS claimant count, Lichfield district, aged 16 to 24
- ONS claimant count, Staffordshire districts
- ONS claimant count, Lichfield wards
- ONS Claimant Count Quality and Methodology Information
- Lichfield District Council benefits and money advice
Have your say