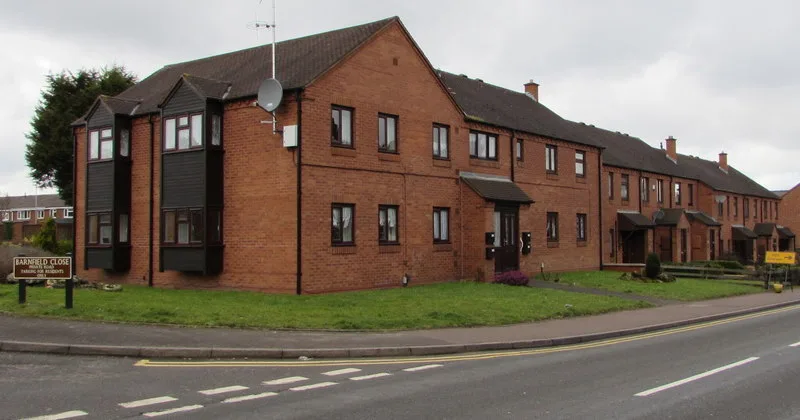

The average Lichfield home sold for £337,052 in June, up 3.9% in a year and £26,794 clear of South Staffordshire. The dearest district in the county, by type.
The average home in Lichfield district sold for £337,052 in June 2026, which makes it the most expensive place to buy in Staffordshire by a clear margin. The figures come from the Land Registry’s UK House Price Index, published this week.
Lichfield is £26,794 ahead of South Staffordshire, the county’s second dearest district, and £188,253 ahead of Stoke-on-Trent at the other end. It is also dearer than Solihull, at £334,966, which is not how most people in the West Midlands would rank the two.
Prices rose 3.9% over the year, more than double the 1.8% recorded across England. But June was slightly down on May, by 0.3%, and May is the highest monthly average the district has ever recorded in this index.
Where Lichfield sits in the county
One thing that number does not mean is that Lichfield is the fastest riser. Of Staffordshire’s nine authorities it is sixth on annual growth. Staffordshire Moorlands went up 9.4% over the year, Newcastle-under-Lyme 6.6% and South Staffordshire 5.8%. Lichfield is an expensive market growing steadily, not a market taking off.
Nationally the district sits in the middle. Its 3.9% was the 108th highest annual change of the 295 local authority areas in England, and 62 of those areas saw prices fall over the year.
What each type of home costs
| Type | Average price | Change over 12 months |
|---|---|---|
| Detached | £523,122 | +3.1% |
| Semi-detached | £315,985 | +4.9% |
| Terraced | £250,686 | +4.7% |
| Flat or maisonette | £163,293 | +1.9% |
| First-time buyer | £266,402 | +4.3% |
The spread is the striking part. A detached house in the district costs 3.2 times what a flat costs. Flats also rose the least, at 1.9%, so the cheapest way into the district is the part of the market moving slowest, which is unusual and helpful if you are buying one.
The middle of the market did the work this year. Semi-detached homes were up 4.9% and terraces 4.7%, both ahead of the district average, while detached homes rose 3.1%. That is the opposite of the pattern in the years after 2020, when the largest houses pulled the average up.
A correction worth making
We published the May figure of £337,175, up 4.5%, on our Lichfield house prices page. The Land Registry has since revised that month to £338,204, up 4.8%, an increase of £1,029.
This happens every month and it is not an error by anyone. The index is built from completed sales, and sales keep being registered after a month is first published, so the first version of any month is provisional. The smaller the district, the bigger the swings can be. It is worth knowing before you treat a single month’s figure as settled.
What it means for you
- If you are selling, the district average is within £1,152 of its record high. There is no evidence in this release of prices falling in Lichfield, but there is no surge either.
- If you are buying your first home, the relevant figure is £266,402, not £337,052. The first-time buyer average is roughly £70,000 below the headline, because first-time buyers mostly buy the terraces and flats rather than the detached stock that drags the mean upwards.
- If you are comparing areas, Cannock Chase is £106,451 cheaper than Lichfield and Tamworth £106,574 cheaper, both within commuting distance. Burntwood sits inside the Lichfield district figure, so the district average understates the city and overstates the north west of the district.
- Do not read the average as a typical house. UKHPI is a mean, not a median, so a handful of large sales in a small district move it.
Sales volumes are not yet published for May or June. The most recent month with a count is April 2026, when 83 homes were sold in the district. Comparisons with spring 2025 are unreliable because of the stamp duty threshold change on 1 April 2025: the district recorded 271 sales in March 2025 and 69 in April, against 97 and 83 in the same months this year. That is a rush to complete, not a collapse in demand.
The next release, covering July 2026, is due in September. Our house prices page carries the fuller picture for the district, including how Lichfield compares with Burntwood, and our planning news page tracks the schemes that will add to the housing stock.
Sources
- HM Land Registry, UK House Price Index for Lichfield for the district figures, the property type splits and the first-time buyer average.
- UK House Price Index full data file, June 2026 for the comparison with all 295 English local authority areas, the Staffordshire ranking, the sales volumes and the revision to the May figure.
- UK House Price Index, about the index for the mean average methodology and the revision policy.
Figures are for completed sales registered with HM Land Registry and are averages for the whole of Lichfield district, which includes Burntwood, Alrewas, Shenstone, Whittington, Fradley and Fazeley.
Update, 17 September 2026: HM Land Registry has since revised the June figure to £334,519, up 3.1%, and on the revised figures Solihull (£337,526) was dearer than Lichfield in June. The district’s highest recorded average is now March 2026, at £337,720. The figures above are the first estimates published in August. The July 2026 figures have the latest.
Have your say