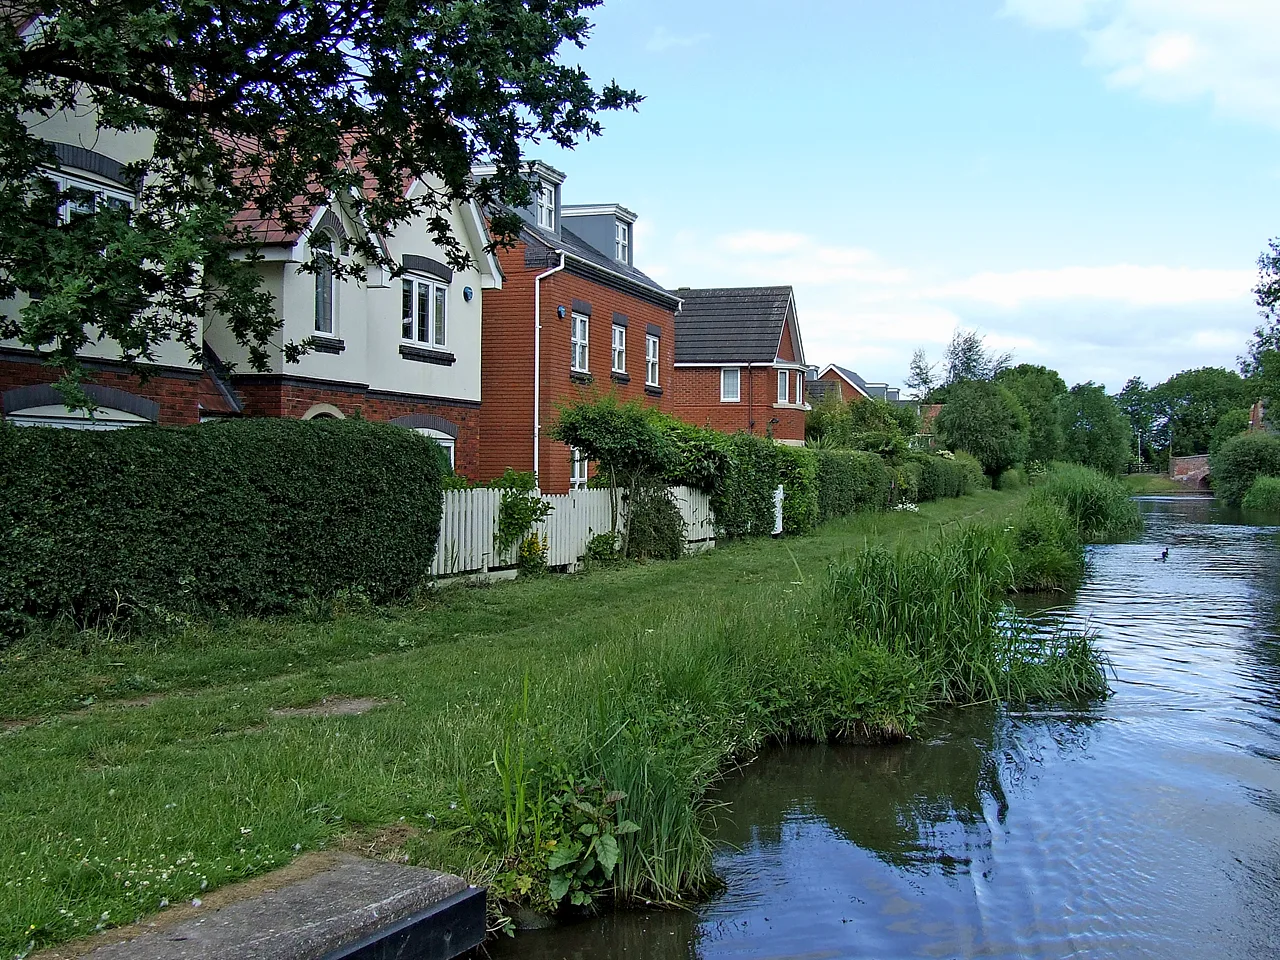

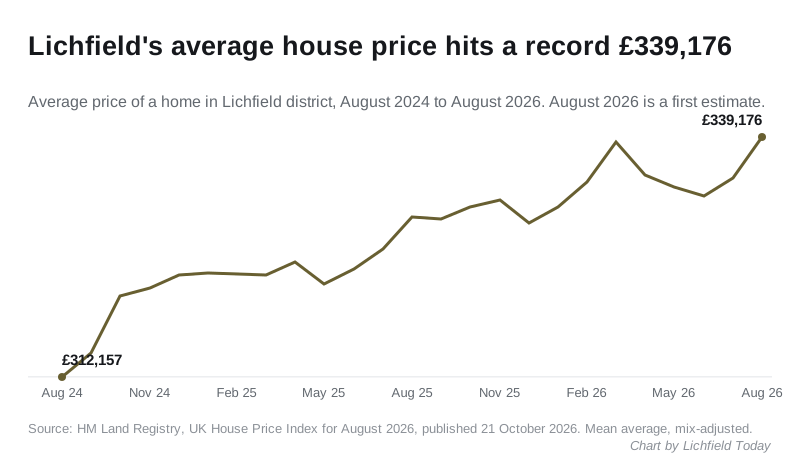
The average Lichfield district home hit a record £339,176 in August, up 2.7% in a year on the first estimate, and back ahead of Solihull and Bromsgrove.
The average home in Lichfield district was worth £339,176 in August 2026. That is the highest figure the district has recorded, £584 above the previous peak in March this year.
Prices rose 1.4% in a single month and are up £9,048, or 2.7%, on August 2025. The figures come from HM Land Registry’s UK House Price Index for August 2026, published on 21 October.
Treat the record with some caution. August is a first estimate, built from the sales registered so far. Last month’s first estimate for July was cut by £1,217 this month, so a revision of that size would take August back below March.
A note on the number itself. The index figure is a mean average of sold prices, adjusted for the mix of homes sold. It is not a median, so a few large sales pull it upwards, and a typical sale in the district is below it.
The dearest place in Staffordshire, and fourth for growth
Lichfield is still the most expensive of Staffordshire’s nine local authority areas. It is £30,481 above South Staffordshire, the second dearest, and £88,057 above the Staffordshire average of £251,119.
Last month Lichfield sat joint sixth in the county for growth. In August it was fourth.
| Area | Average price | Change on August 2025 |
|---|---|---|
| Newcastle-under-Lyme | £208,269 | +5.2% |
| Staffordshire Moorlands | £224,481 | +5.1% |
| Stafford | £260,446 | +3.5% |
| Lichfield | £339,176 | +2.7% |
| South Staffordshire | £308,695 | +2.3% |
| East Staffordshire | £229,876 | +2.0% |
| Tamworth | £232,956 | -0.1% |
| Stoke-on-Trent | £150,112 | -0.2% |
| Cannock Chase | £231,333 | -1.3% |
Across England, Lichfield’s 2.7% was the 73rd highest annual change of the 295 local authority areas. Prices fell over the year in 107 of them. England as a whole rose 0.4%, to £293,525, and the West Midlands region 1.2%, to £250,731.
Back ahead of Solihull
In July, on the figures as first published, Solihull was £1,313 dearer than Lichfield and Bromsgrove was close behind. August reverses that:
| Area | Average price, August 2026 | Change on August 2025 |
|---|---|---|
| Lichfield | £339,176 | +2.7% |
| Bromsgrove | £332,683 | +1.2% |
| Solihull | £332,022 | +0.2% |
Lichfield is now £7,154 above Solihull and £6,493 above Bromsgrove. That gap is large for one month’s movement, and most of it comes from Lichfield’s 1.4% jump in August, so it may narrow when the figures are revised.
What each type of home costs
| Type | Average price, August 2026 | Change on August 2025 |
|---|---|---|
| Detached | £524,798 | +2.4% |
| Semi-detached | £318,271 | +3.7% |
| Terraced | £253,811 | +3.4% |
| Flat or maisonette | £164,083 | 0.0% |
| First-time buyer | £268,406 | +3.0% |
Semi-detached and terraced homes rose fastest, as they did in June and July. Flats were unchanged on the year, the only type not rising. At £164,083, the average flat costs less than a third of the average detached house.
July has been revised down, March up
The first estimate for July, which we reported in September, was £335,799, up 2.8%. The Land Registry now puts July at £334,582, up 2.5%, a cut of £1,217.
Revisions also moved the earlier peak. In September the district’s highest month was March 2026, at £337,720. March now stands at £338,592, and August’s first estimate is £584 above that.
This is normal for the index. Sales for any month keep being registered for weeks afterwards, so the latest month is always provisional.
Sales counts run two months behind. The latest, for June 2026, recorded 81 sales in the district, against 142 in June 2025. The May count, first published as 68, now stands at 74. Small monthly counts are one reason a district figure swings more than the national one.
What it means for you
- If you are selling, the district average is at a record on the first estimate, and still rising faster than England’s.
- If you are buying your first home, use £268,406, the first-time buyer average, rather than the £339,176 headline.
- If you are buying a flat, the average has gone nowhere in a year, which is better news for buyers than sellers.
- If you are comparing areas, Tamworth averages £232,956 and Cannock Chase £231,333, more than £100,000 below Lichfield, and both fell over the year.
- Treat August as provisional. On recent evidence it could move by £1,000 or more when September is published.
The September figures are due from the Land Registry in November. Our house prices page has the longer picture for the district, and our planning news follows the schemes, including Arkall Farm and the Local Plan 2046 consultation, that decide how many homes get built here.
Sources
- HM Land Registry, UK House Price Index for August 2026, published 21 October 2026.
- UK House Price Index full data file, August 2026 for the district figures, the property type splits, the first-time buyer average, the sales counts, the revised July, May and March figures, and the ranking of all 295 English local authority areas.
- UKHPI data for Lichfield, August 2026 and the equivalent records for the other Staffordshire authorities, Solihull, Bromsgrove, the West Midlands region and England.
Figures are averages for the whole of Lichfield district, which includes Burntwood, Alrewas, Shenstone, Whittington, Fradley and Fazeley.
Have your say